Production: Pilot · Live at Pfleiderer Arnsberg

Improve quality, Reduce waste.

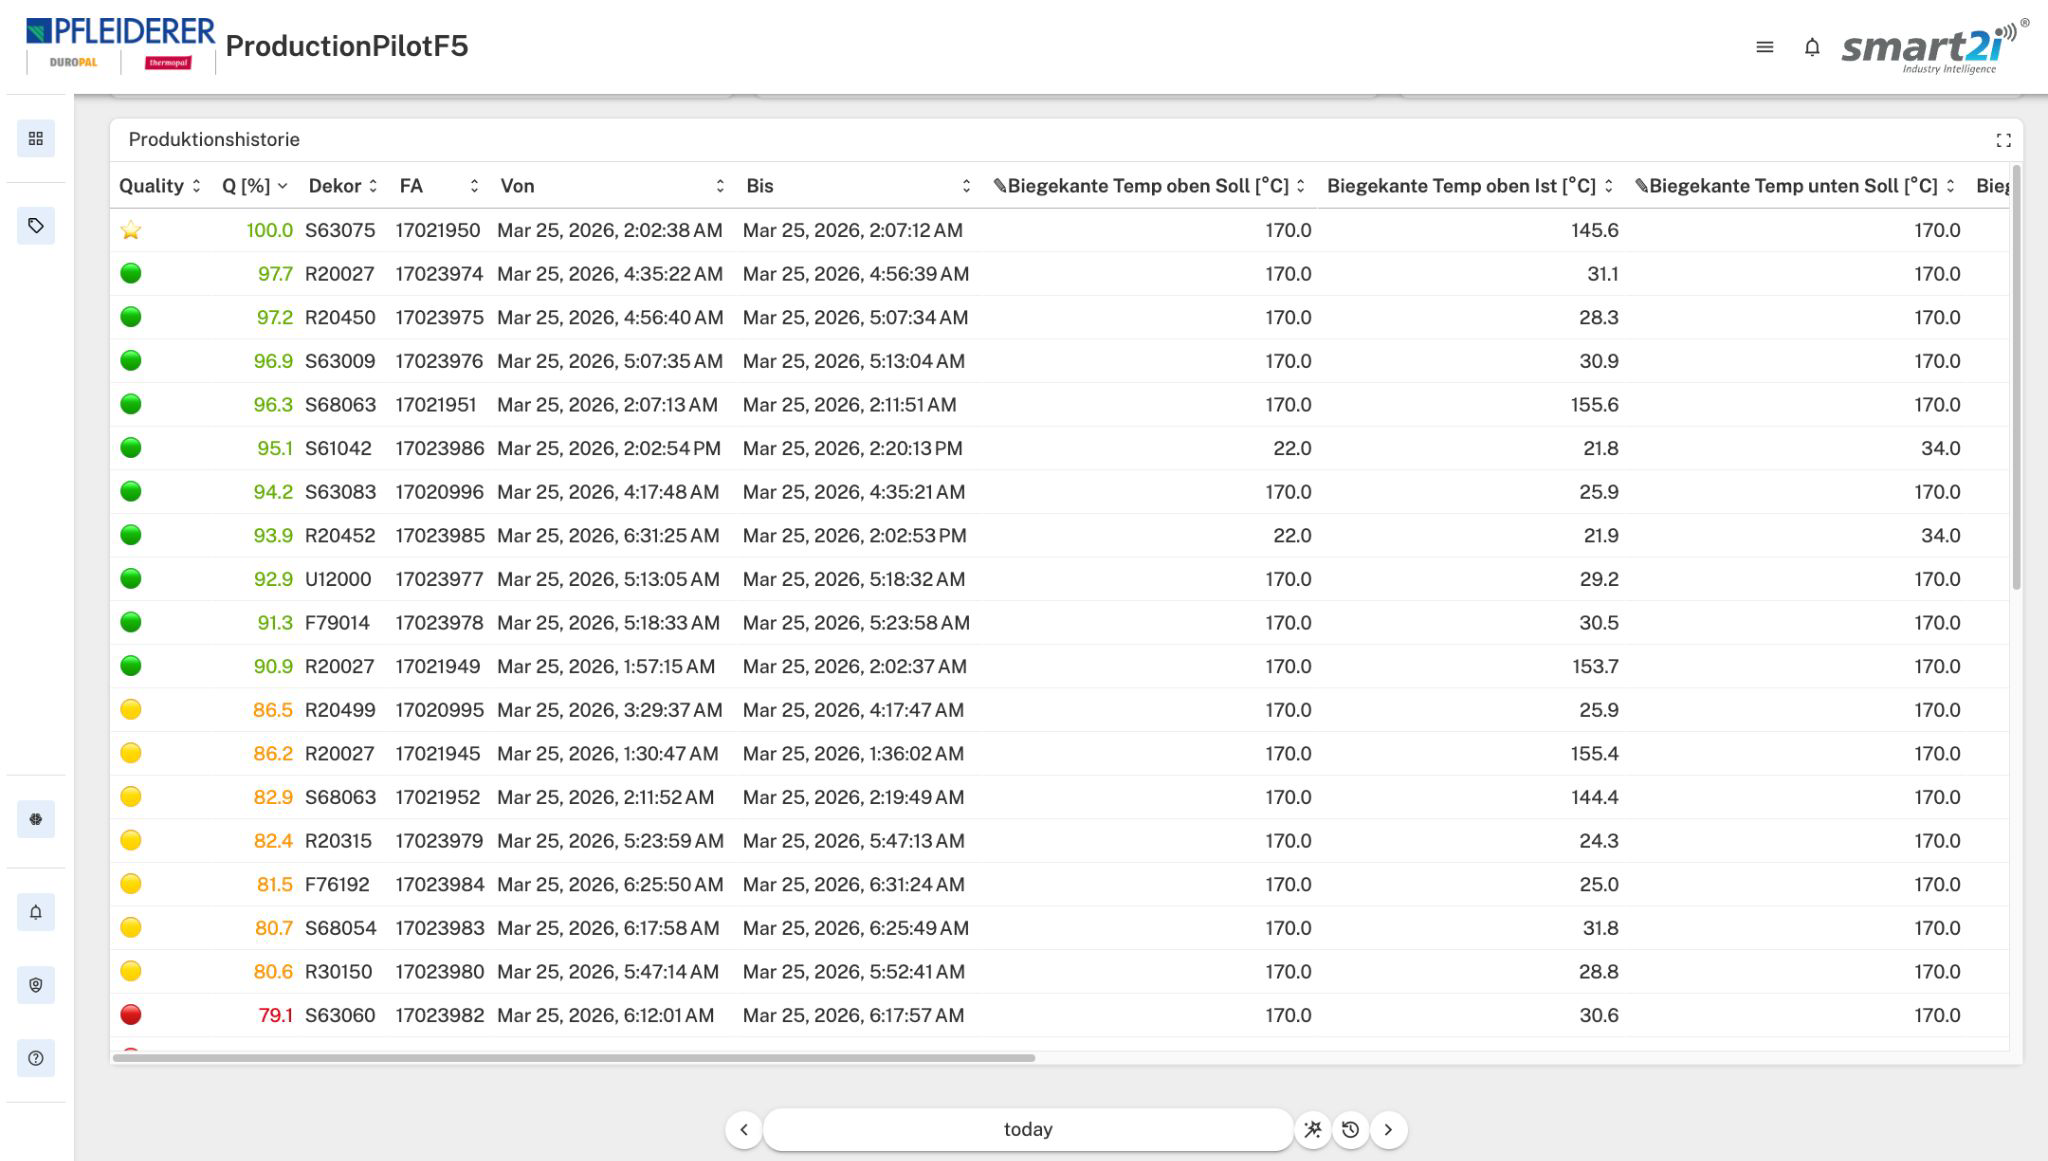
Production:Pilot brings smart2i directly into production: target values, live data and laboratory results are consolidated in a single dashboard, deviations are immediately visible and can be rectified whilst production is underway. Initial implementation at Pfleiderer Arnsberg.

production:pilot
  • Verification of production and quality data
  • Transparency regarding all relevant production parameters
  • Linking target values, real-time data and laboratory results
  • Immediate detection of deviations
  • The basis for data-driven process optimisation
portal.smart2i.cloud / ProductionPilot F5
ProductionPilot F5 Dashboard at Pfleiderer Arnsberg, recipe input, live parameters, lab tests, and production history in a single view

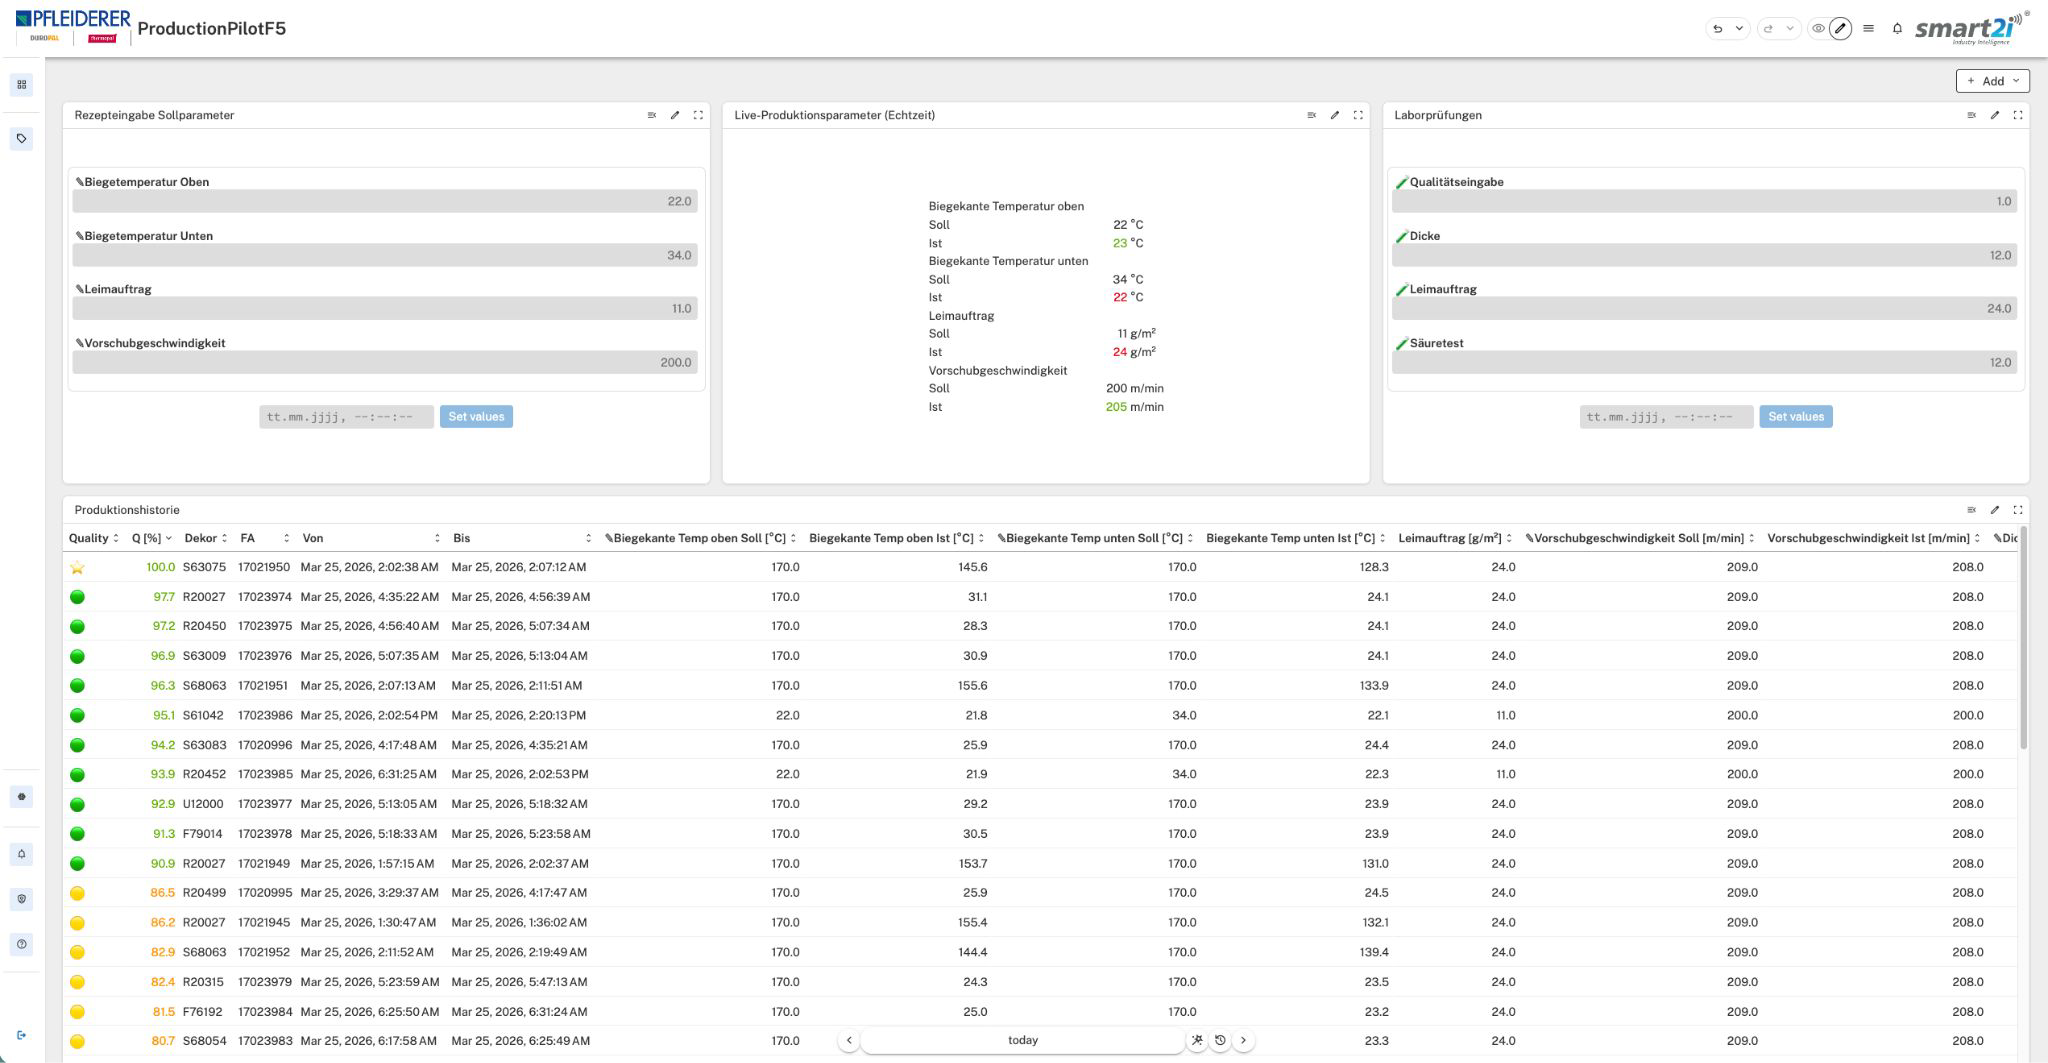
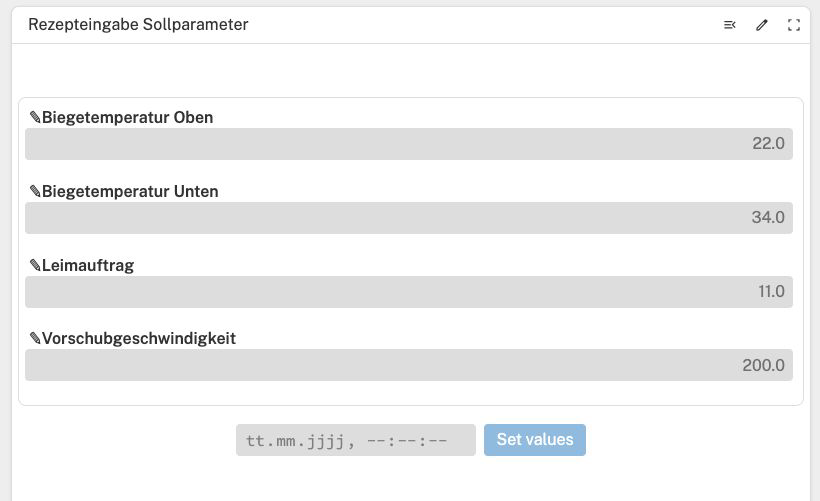
ProductionPilot F5 · Pfleiderer Arnsberg. Target parameters, real-time values, laboratory results and the complete production history, all in a single dashboard.

The philosophy behind it

“Here at smart2i, our guiding principle is always: It should be as simple as possible."

In times of skills shortages, it is crucial to provide maximum support to workers, with clear guidelines, visible deviations and a tool that can be operated without the need for training.

How the pilot works

From the recipe to the history, a continuous flow of data.

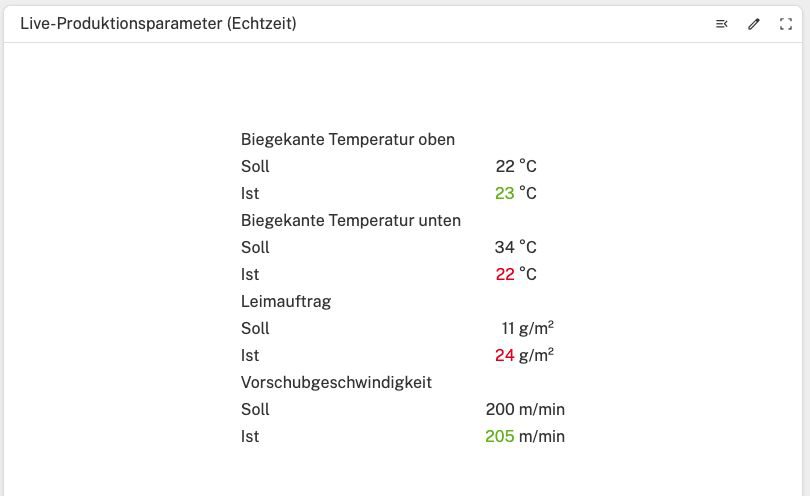
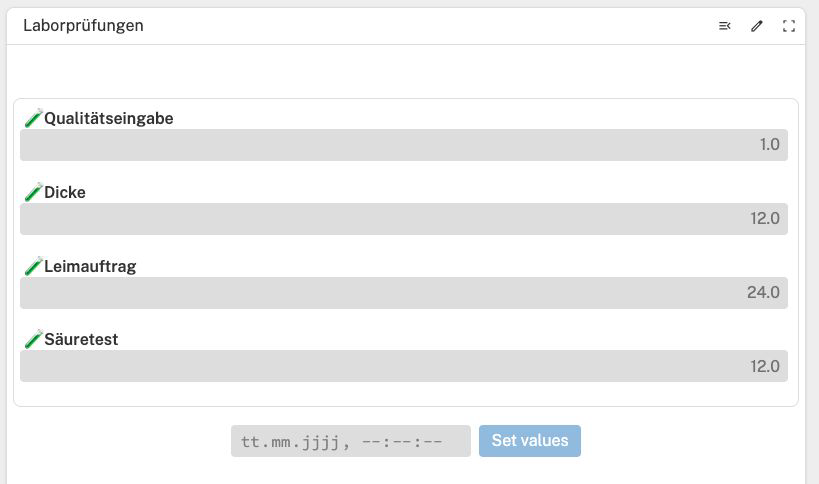
Four building blocks tie target values, live production and lab quality into an unbroken chain, the basis for continuous improvement.

1 Recipe entry

Clear targets for each run.

  • Entering the target parameters (formula), focusing on the key production values
  • Endlessly expandable, clear guidelines for the ongoing process
  • Basis for real-time target-actual comparison
  • In future: centralised recipe management with reusable settings
Ziel Minimise errors & establish control

“… in times of skills shortages, it is crucial to provide workers with as much support as possible!

Recipe input parameters, top/bottom bending temperature, glue application, feed speed
2 Live parameters

Real-time comparison with a tolerance of ±10%.

  • Real-time display of all relevant production parameters
  • Direct comparison of target and actual values for each parameter, displayed with a ±10% tolerance range
  • Green = within tolerance · Red = deviation
  • Instant overview, enabling operators to take swift action and take corrective measures
Ziel Increase process stability & secure quality

“Any discrepancies can be rectified immediately whilst the system is running.”

Live production parameters in real time, target/actual comparison with green/red indicators
3 Laboratory input

Quality data is assigned to specific time periods.

  • Post-processing of quality data by the laboratory, e.g. acid test, scratch test
  • Simple, structured data entry
  • Mapping of measurement results to the exact time of production
  • Direct linking of process and quality data, transparency regarding the impact of parameters
Ziel The basis for sound analysis and optimisation

“… with smart2i, we can finally date the laboratory results.”

Laboratory tests, quality control, thickness, adhesive application, acid test
4 Production history

Find and replicate the ‘Golden Batch’.

  • Overview of all production runs, including decoration, target/actual comparison for each production run
  • Presentation of the relevant quality data and analysis of the relationship
  • Identifying optimal settings, the ‘Golden Batch’
  • The transferability of successful parameters to future productions
Ziel Continuous Improvement & Reduction of Waste

“… only by constantly adapting and optimising can we be successful.

Production history, all runs with quality score, design, and target/actual values
Ready for transparent production?

Let us be your pilot plan together.

30-minute initial consultation, we’ll discuss your use case, data sources and whether a pilot project would be suitable for your organisation.